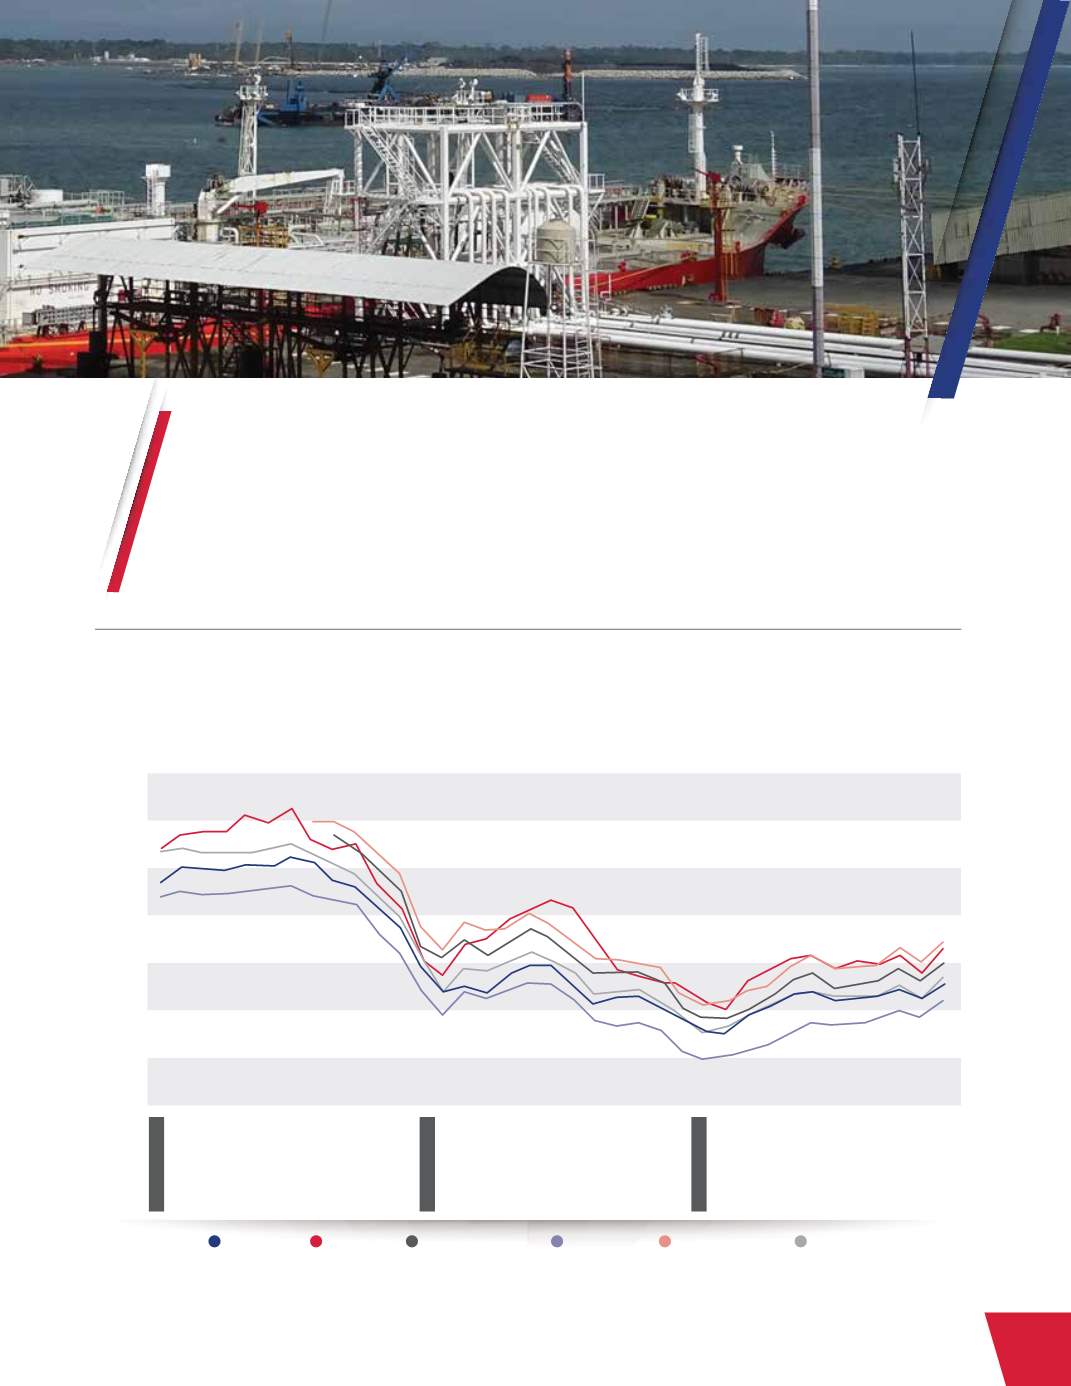
The chart below shows the price variations, in 2014-2016, of the following crude oil fuels: WTI, BRENT, fuel oil
3%, UNL-87 gasoline, UNL-89 gasoline, jet fuel and ultra-low-sulfur diesel.
140,00
120,00
100,00
80,00
60,00
40,00
20,00
0
JANUARY 2014
FEBRUARY
MARCH
APRIL
MAY
JUNE
JULY
AUGUST
SEPTEMBER
OCTOBER
NOVEMBER
DECEMBER
FEBRUARY
MARCH
APRIL
MAY
JUNE
JULY
AUGUST
SEPTEMBER
OCTOBER
NOVEMBER
DECEMBER
FEBRUARY
MARCH
APRIL
MAY
JUNE
JULY
AUGUST
SEPTEMBER
OCTOBER
NOVEMBER
DECEMBER
JANUARY 2015
JANUARY 2016
2014
2015
2016
WTI
GASOLINE
DIESEL No.2 0.2%S
FUEL OIL
DIESEL ULSD
BRENT
Variations in the average monthly price per barrel (US $/bbl) of Brent and WTI crude oil,
and other petroleum products, in the United States Gulf Coast
2014-2016
Source: Department of International Fuel Commerce January 2017.
11
2016 ANNUAL REPORT


