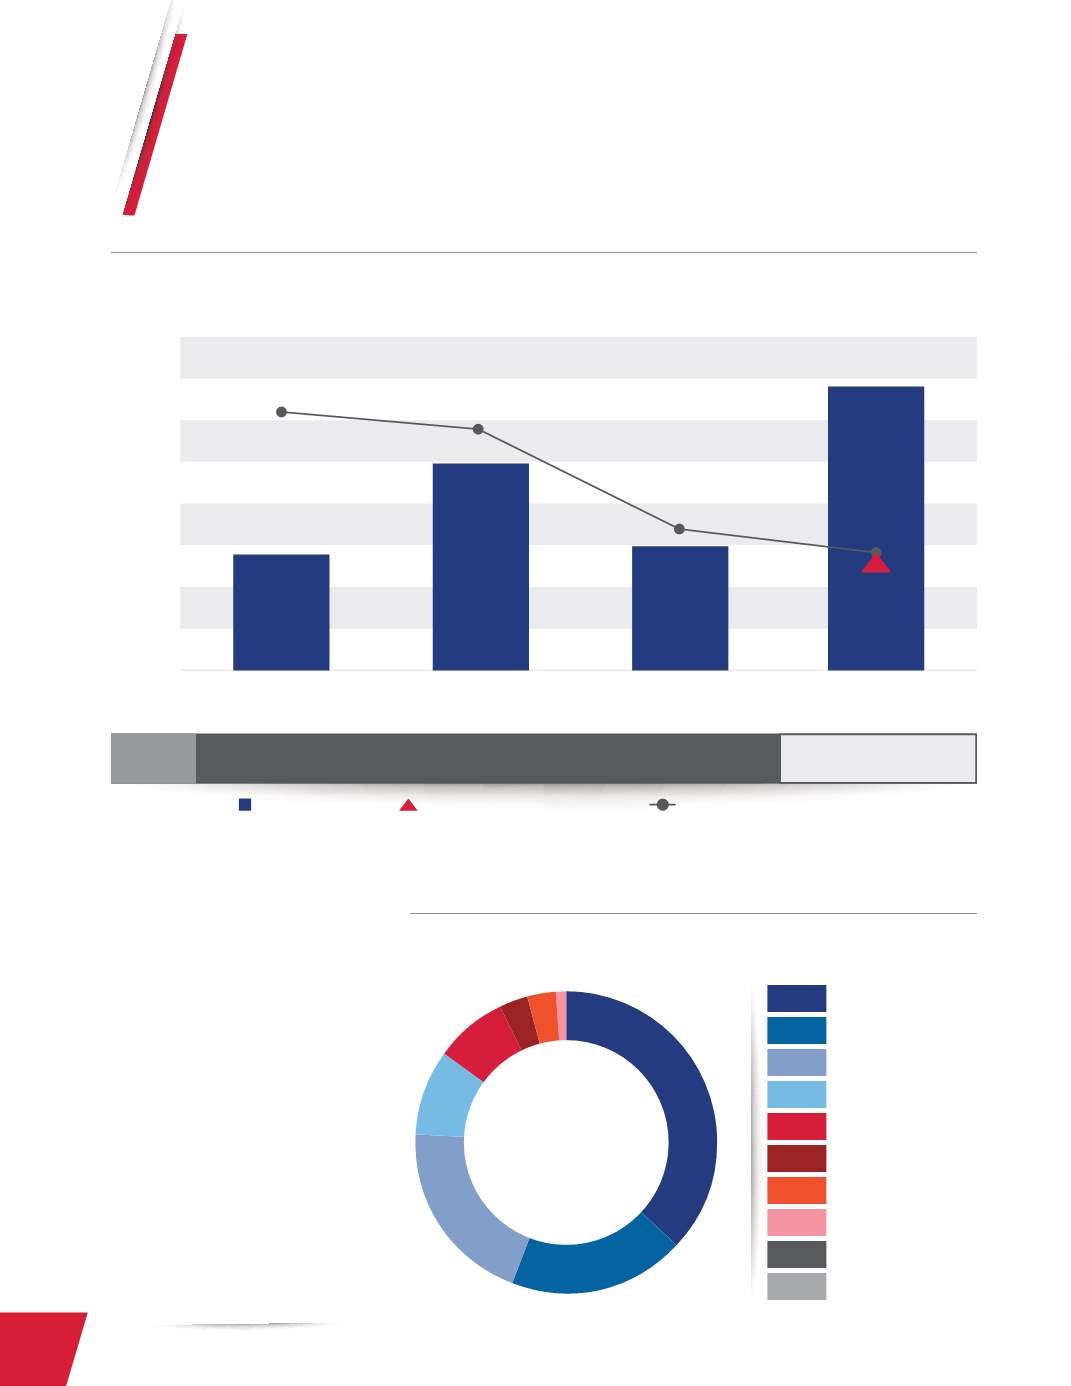
Breakdown of Oil Imports
3,200
3,250
3,150
3,100
3,050
3,000
2,950
2,900
2,850
2014
2013
2015
2016
$2,106 MILLIONS
$2,182 MILLIONS
$1,215 MILLIONS
$1,073.56 MILLIONS
ACTUAL VOLUME m
3
ESTIMATED WEIGHTED PRICE ($/BBL)
ACTUAL AVERAGE PRICE ($/BBL)
OIL
INVOICE
2,999
3,112
3,011
64.2
53.4
107.8
3,213
VOLUME (thousands of m
3
)
Imports: Import volume (m³), average price per barrel ($/bbl), and invoice amount.
2013-2016
Note: the data from 2013 to 2016 are the actual values.
Source: Department of International Fuel Commerce. January 2017.
An analysis of RECOPE’s annual import
volume revealed that diesel was the most
imported petroleum-based product in
2016, followed by gasoline. However, if
the import volumes of UNL-87 gasoline
and UNL-89 gasoline are added together,
the resulting total volume would account
for a greater percentage of imports in
comparison to diesel.
37%
DIESEL
is the most imported petroleum-based
product in 2016
DIESEL 0.0015%S
37%
91 RON GASOLINE
19%
95 RON GASOLINE
20%
LPG
9%
JET FUEL
8%
FUEL OIL 3% S
3%
ASPHALT AC-30
3%
FUEL OIL 1% S
1%
AVGAS
0%
MTBE
0%
2016
Itemization and Breakdown of Oil Import Volumes as at
December 2016
Source: Department of International Fuel Commerce. January 2017.
12
2016 ANNUAL REPORT


