29
2016 ANNUAL REPORT
an increase in the frequency of pricing
adjustments caused by delays, which
now occur on a bimonthly basis rather
than on a semiannual basis.
Operating profits maintained an upward
trend as at September 30
th
(after the
stabilization of the price differentials
exhibited in the last few months), rising
to $2 million just before the start of Q4
2016, in stark contrast to the company’s
Net Profits, which fell to negative $11
million.
The net profit margin for the year closed
at +0.53% as at December 2016, up
from -0.81% in December 2015. The
year, however, closed with a fiscal deficit
which was ameliorated by a deferred
income tax of $5 million. The company
reported a net operating loss of $52
million in its year-end Comprehensive
Income statement.
In view of the accounting entry
adjustments required after the
revaluation of assets, and following
the analysis of the audited statement
of financial condition, the company’s
book loss grew by $15 million due to
the construction of permanent projects;
this adjustment affected the “Retained
Earnings” accounting entry. In view
of the above, the company reported a
profit/loss of $52 million.
Balance Sheet
Total Assets
Total assets as at December 2016
decreased by $37 million, down by
2.27% in relation to 2015.
Current assets as at December 2016
grew $9 million, up by 1.43% in relation
to 2015. Current assets include: product
inventory; accounts receivable; and cash
and cash equivalents, as at December
2016.
Product inventory accounted for 68.54%
of the current assets and 13.11% (up
from 12.29% in 2015) of the total assets.
Before the revaluation of assets in 2015,
fixed assets accounted for 50% of the
total assets, current assets (which were
heavily influenced by the inventory
level of hydrocarbons) accounted for
46%, and other assets accounted for
the remaining 4%. After the revaluation
of assets, fixed and current assets grew
to 77% and 18%, respectively, due to
an increase in the inventory level of
hydrocarbons in 2016, which grew by
$16 million in relation to December
2015; this represents a 19% increase in
volume, not in price.
Total inventory (including materials)
grew by $9 million (4.32%), up from
$199 million in 2015 to $288 million in
2016 (as at December 31
st
). This increase
in inventory is mostly attributable to a
greater volume of imports and not to
the import price of hydrocarbons, as
the price of these products presented a
downward trend in 2016.
The average price per barrel of the CIF
value of import as at December 31
st
,
2016, was $53.12/bbl, down from
$64.15/bbl (-$11.03/bbl) in 2015.
Notwithstanding the above, the product
inventory in 2016 showed a drop of $2
million in relation to the previous year.
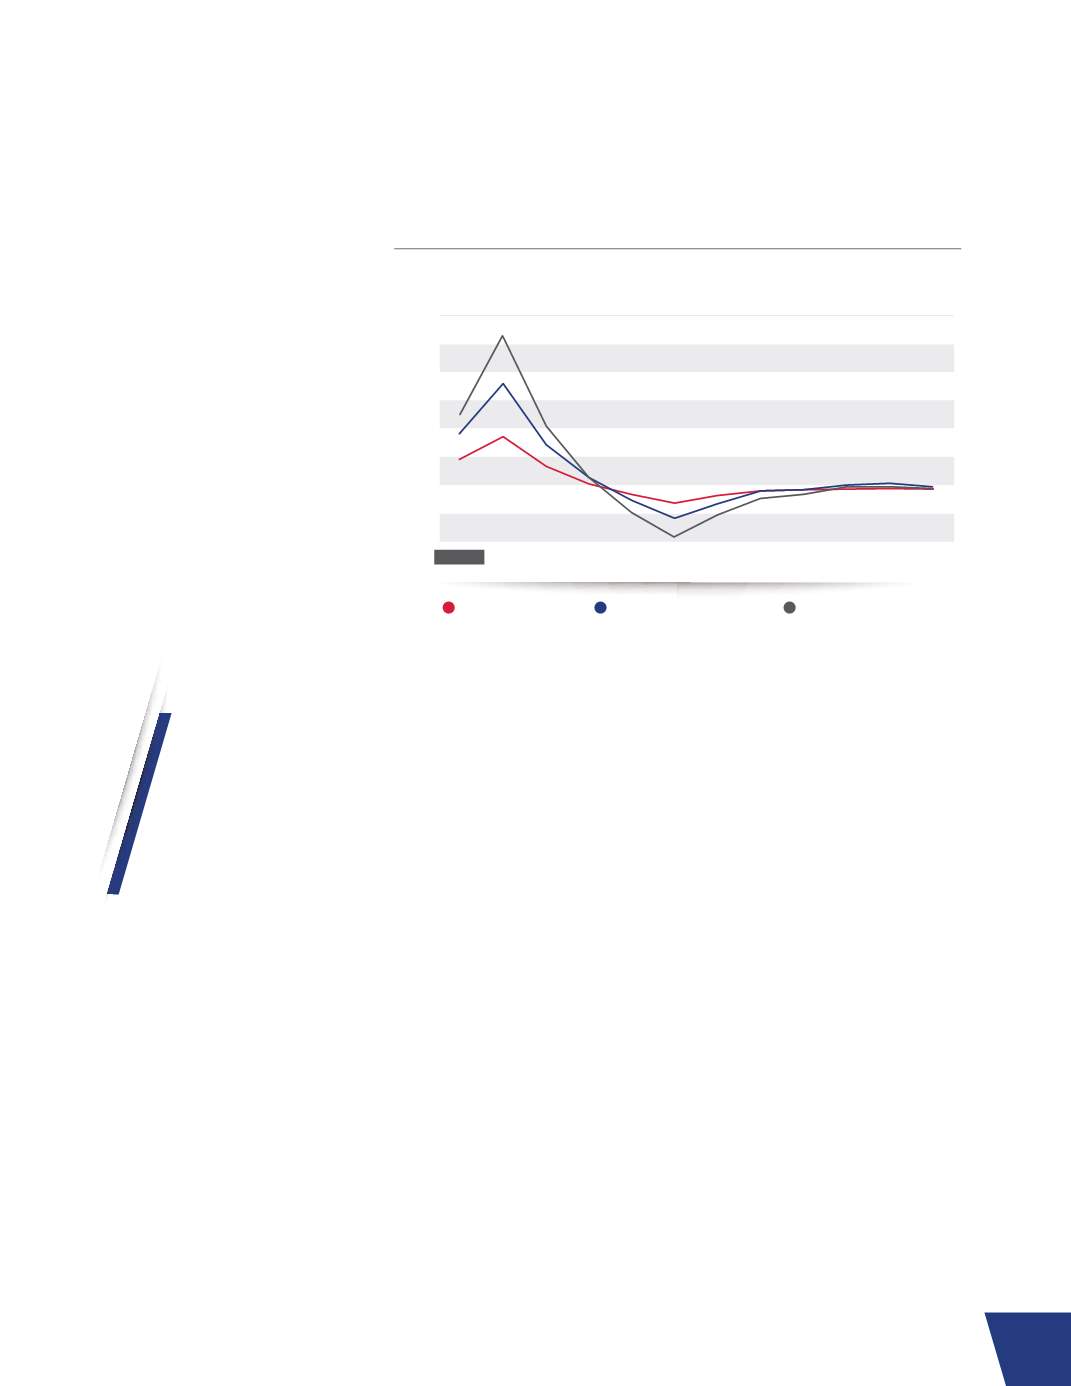
All but two of the products, Premium
40%
35%
30%
25%
20%
15%
10%
5%
0%
FEB MAR APR MAY JUN JUL AUG SEPT OCT NOV DEC
JAN-2016
Gross profit margin
Operating sales margin
Net sales margin
Profit margin


